Fig. 14
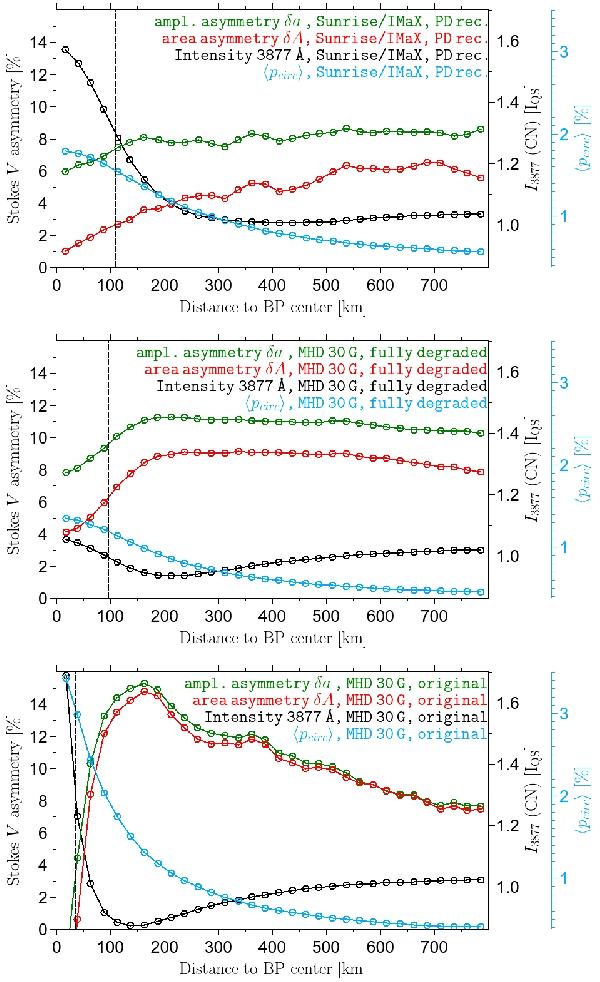
Stokes V amplitude (green lines) and area (red lines) asymmetries, intensity in the 3877 Å CN band (black lines), and circular polarization degree (blue lines) of the reconstructed IMaX observations (top panel), degraded (middle panel), and original (bottom panel) 30 G MHD simulations as a function of the distance to the BP center. The dashed black lines display the half width half maximum value of the mean intensity profile.
Current usage metrics show cumulative count of Article Views (full-text article views including HTML views, PDF and ePub downloads, according to the available data) and Abstracts Views on Vision4Press platform.
Data correspond to usage on the plateform after 2015. The current usage metrics is available 48-96 hours after online publication and is updated daily on week days.
Initial download of the metrics may take a while.