Fig. 1
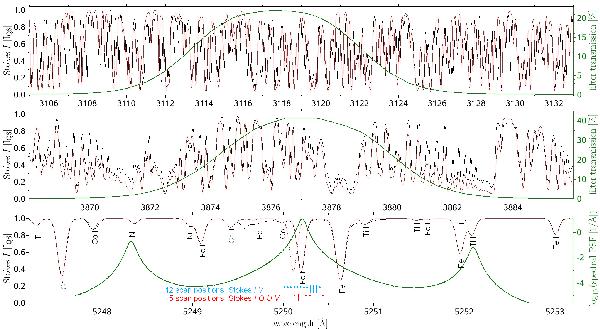
Excerpts from an NSO spectral atlas (black lines; Kurucz et al. 1984), spatially averaged synthetic spectra (red lines; see text for details), and instrumental filter profiles (green lines referring to the scale on the right side of the figure) for the part of the OH band around 3118 Å (top panel), the CN band at 3877 Å (middle panel), and the Fe i line at 5250.2 Å (bottom panel). The dotted red line in the bottom panel simulates the Doppler shifted profile of the Fe i line at 5250.2 Å produced by an upflow of 5 km s-1. The red arrows indicate the five scan positions of the IMaX V5-6 mode, while the twelve blue arrows mark them for the L12-2 mode.
Current usage metrics show cumulative count of Article Views (full-text article views including HTML views, PDF and ePub downloads, according to the available data) and Abstracts Views on Vision4Press platform.
Data correspond to usage on the plateform after 2015. The current usage metrics is available 48-96 hours after online publication and is updated daily on week days.
Initial download of the metrics may take a while.