Free Access
Fig. 12
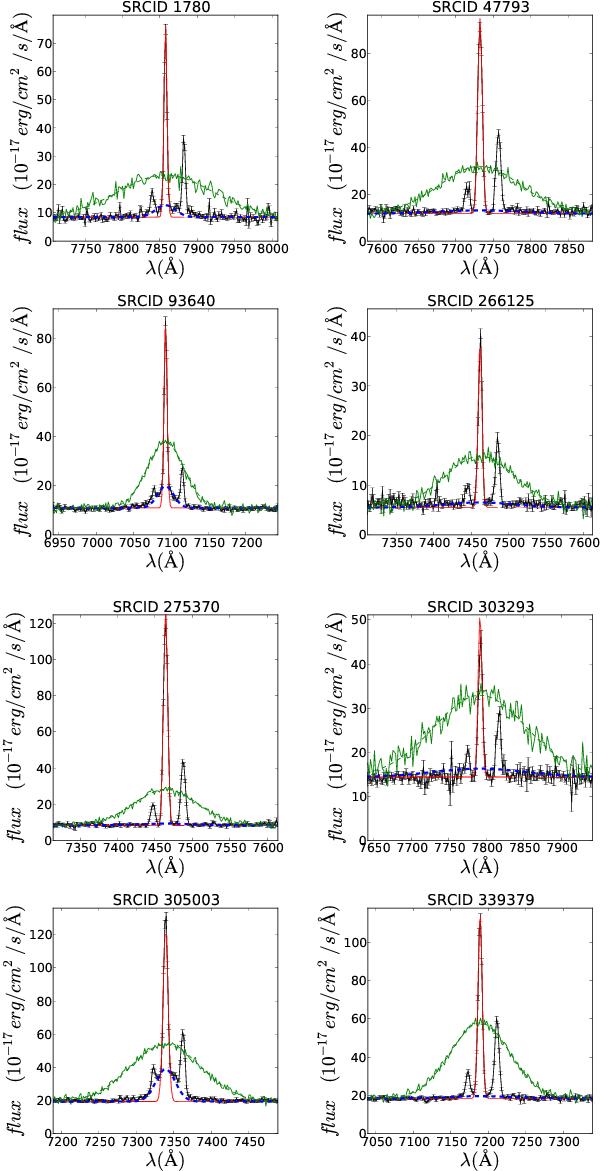
Optical spectra of the true Sy2 candidates around the Hα region. The observed Hα line is fitted with a Gaussian profile (red curve) while the predicted broad component is represented by a Gaussian (green). The dashed blue line represents the fitted weak broad line or the upper limit to the broad component.
This figure is made of several images, please see below:
Current usage metrics show cumulative count of Article Views (full-text article views including HTML views, PDF and ePub downloads, according to the available data) and Abstracts Views on Vision4Press platform.
Data correspond to usage on the plateform after 2015. The current usage metrics is available 48-96 hours after online publication and is updated daily on week days.
Initial download of the metrics may take a while.