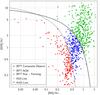
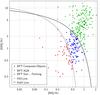
Fig. 1

BPT emission line diagnostic diagrams. The K03 line in grey separates the SF galaxies and composite object regions, while the Ke01 demarcation line in black distinguishes between optically-classified AGN and composite objects. Left panel: NELG sample which consists of 797 sources (45% of BPT-AGN (green symbols), 31% composite objects (blue symbols) and 24% in the SF region (red symbols)). Right panel: NELG sample with high hard X-ray luminosity (LHX> 1042 ergs-1). There are 172 sources (54% of the sample) classified as BPT-AGN (green symbols), 103 sources (blue symbols) classified as composite objects and 41 sources (13%) in the SF region of the diagram (red symbols; our elusive AGN).
Current usage metrics show cumulative count of Article Views (full-text article views including HTML views, PDF and ePub downloads, according to the available data) and Abstracts Views on Vision4Press platform.
Data correspond to usage on the plateform after 2015. The current usage metrics is available 48-96 hours after online publication and is updated daily on week days.
Initial download of the metrics may take a while.