Fig. 2
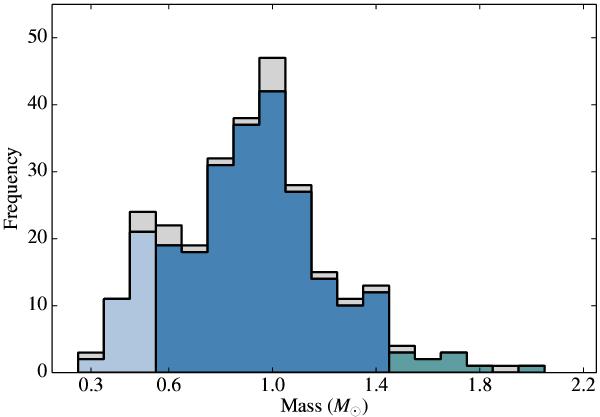
Mass distribution of all targets used in this work calculated by using available effective temperatures from da Silva et al. (2009) and derived masses using Baraffe et al. (2003) models <0.6 M⊙ – light blue, Baraffe et al. (1998) models between masses 0.6−1.4 M⊙ – dark blue, and Siess et al. (2000) models >1.4 M⊙ – green. The grey represents multiple system primary masses.
Current usage metrics show cumulative count of Article Views (full-text article views including HTML views, PDF and ePub downloads, according to the available data) and Abstracts Views on Vision4Press platform.
Data correspond to usage on the plateform after 2015. The current usage metrics is available 48-96 hours after online publication and is updated daily on week days.
Initial download of the metrics may take a while.