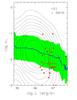
Fig. 8
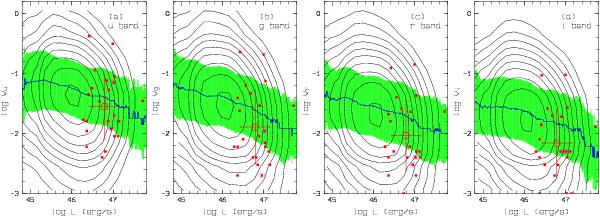
Variability index V in the u, g, r, and i band (left to right) versus luminosity for the 23 WLQs identified in the variability catalogue (filled red squares, magenta frames: WLQ-EWS subsample). For comparison, the entire sample from the variability catalogue is indicated by the median relation (thick blue curve) with standard deviation (shaded green area) and by the equally spaced logarithmic local point density contours (estimated with a grid size of Δx,Δy = 0.2,0.2). Open circle with error bars: mean value and 1σ deviations of the WLQs.
Current usage metrics show cumulative count of Article Views (full-text article views including HTML views, PDF and ePub downloads, according to the available data) and Abstracts Views on Vision4Press platform.
Data correspond to usage on the plateform after 2015. The current usage metrics is available 48-96 hours after online publication and is updated daily on week days.
Initial download of the metrics may take a while.