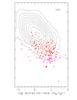
Fig. 7
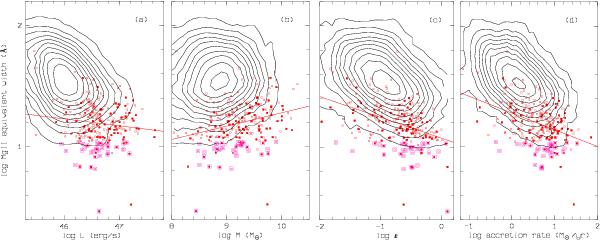
Equivalent width of the Mg ii line versus a) bolometric luminosity; b) black hole mass; c) Eddington ratio; and d) accretion rate for the rWLQ sample. Filled red squares: FIRST detected WLQs, open red squares: FIRST undetected, magenta frames: rWLQ-EWS subsample. Straight lines: linear regression curves for the rWLQ sample. The distributions for the comparison sample are indicated by equally spaced logarithmic local point density contours estimated with a grid size of Δx,Δy = 0.1,0.05 dex.
Current usage metrics show cumulative count of Article Views (full-text article views including HTML views, PDF and ePub downloads, according to the available data) and Abstracts Views on Vision4Press platform.
Data correspond to usage on the plateform after 2015. The current usage metrics is available 48-96 hours after online publication and is updated daily on week days.
Initial download of the metrics may take a while.