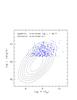
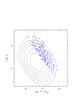
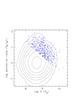
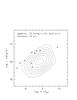
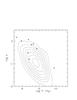
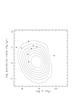
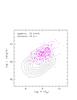
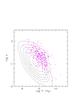
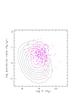
Fig. 5
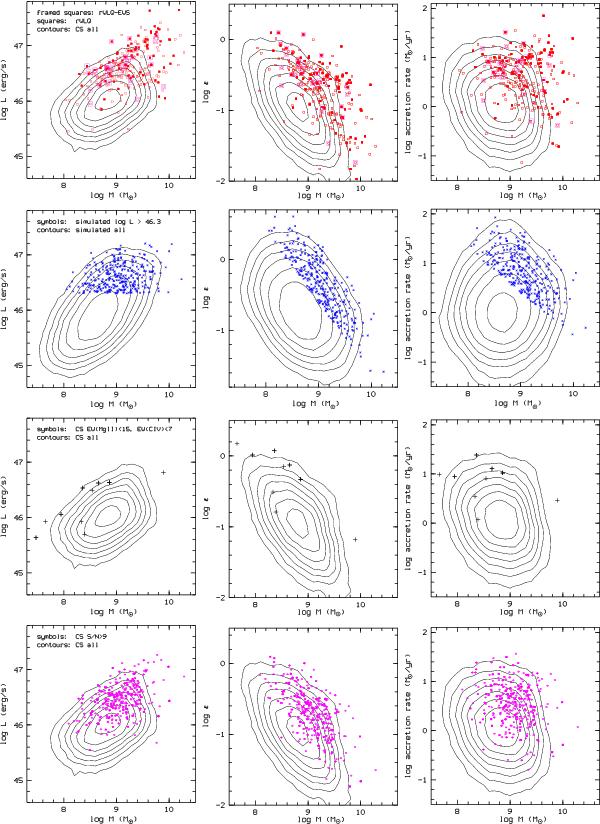
Bolometric luminosity (left), Eddington ratio ε (middle), and accretion rate (right) as a function the black hole mass. Top: rWLQ sample (magenta frames: rWLQ-EWS subsample, filled red squares: FIRST-detected, open red squares: FIRST undetected) and comparison sample (CS; contours). Second row: high-luminosity subsample (blue symbols) from a simulated quasar sample (contours). Third row: The subsample of comparison quasars with WMg ii< 15 Å and WC iv< 7 Å (black symbols) compared with the entire comparison sample (contours). Bottom: quasars with high-S/N spectra (magenta symbols) from the comparison sample compared with the entire comparison sample (contours).
Current usage metrics show cumulative count of Article Views (full-text article views including HTML views, PDF and ePub downloads, according to the available data) and Abstracts Views on Vision4Press platform.
Data correspond to usage on the plateform after 2015. The current usage metrics is available 48-96 hours after online publication and is updated daily on week days.
Initial download of the metrics may take a while.