Fig. 4
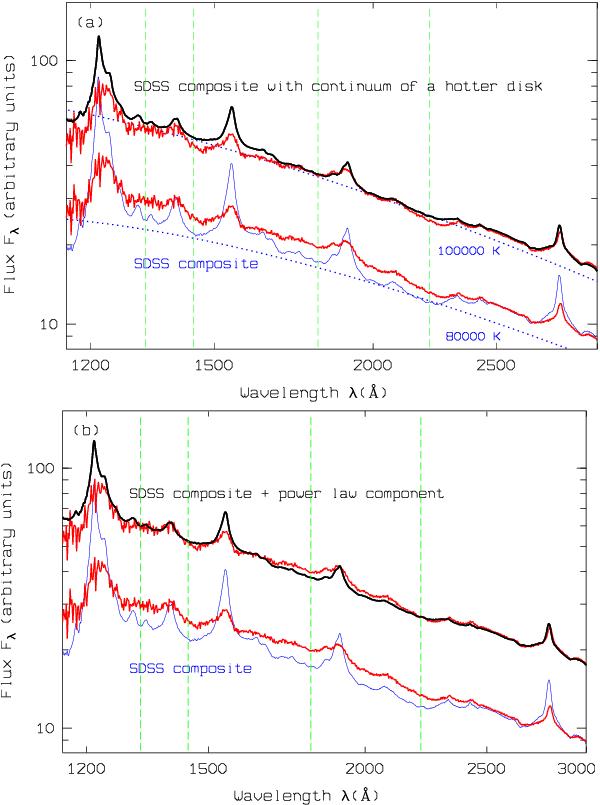
Two interpretations of the steeper slope of the WLQ continuum. a) At the bottom of the panel, the WLQ composite spectrum (red) is compared with the slightly smoothed SDSS quasar composite spectrum (solid blue) fitted by a MTBB model with temperature parameter T∗ = 8 × 10⁴ K (dotted blue). The thick black curve above is a modified version of the SDSS quasar composite with a hotter continuum fitted to the MTBB model for T∗ = 105 K and compared with the WLQ composite spectrum (red) that is normalised to match the former at the right hand side. b) as a), but the modification of the SDSS quasar composite spectrum consists of an additional power-law component instead of a hotter continuum. Vertical lines: continuum windows.
Current usage metrics show cumulative count of Article Views (full-text article views including HTML views, PDF and ePub downloads, according to the available data) and Abstracts Views on Vision4Press platform.
Data correspond to usage on the plateform after 2015. The current usage metrics is available 48-96 hours after online publication and is updated daily on week days.
Initial download of the metrics may take a while.