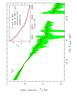
Fig. 10
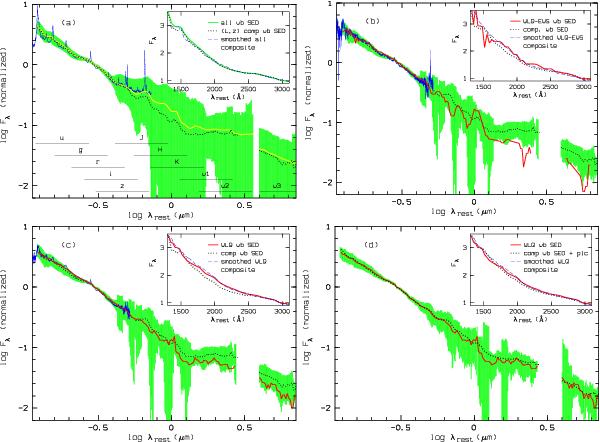
Wide band (wb) SED. a) Shen catalogue with z< 2 (yellow solid curve: median, green shaded area: 1σ errors) and WLQ comparison sample (black dotted curve), normalised at 3000 Å. Over-plotted (blue): SDSS quasar composite spectrum from Vanden Berk et al. (2001). The horizontal lines indicate the wavelengths intervals covered by the different photometric bands. The inset shows the wb SED of all SDSS quasars (solid green) and of the comparison sample (black dotted) in the wavelength range 1300Å −3000 Å in linear scale, as well as the SDSS quasar composite spectrum smoothed with a 300 Å boxcar (blue dashed). b) WLQ-EWS sample (red solid curve) and comparison sample (black dotted curve and green shaded area). Over-plotted (blue): SDSS WLQ composite spectrum from Fig. 3. c) as b), but for the entire WLQ sample instead of the WLQ-EWS subsample. d) as b), but the comparison sample SED is boosted by a power-law component (plc) with αλ = −1.7 and re-normalised, the green shaded area indicates the 1σ errors of the WLQ sample, and the SDSS composite spectrum was omitted for the sake of clarity.
Current usage metrics show cumulative count of Article Views (full-text article views including HTML views, PDF and ePub downloads, according to the available data) and Abstracts Views on Vision4Press platform.
Data correspond to usage on the plateform after 2015. The current usage metrics is available 48-96 hours after online publication and is updated daily on week days.
Initial download of the metrics may take a while.