Fig. 1
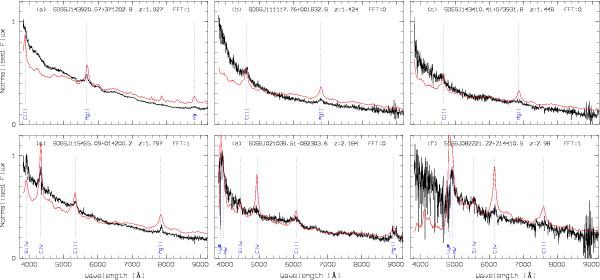
Six examples of quasars with weak emission lines from the WLQ sample. For comparison the quasar composite spectrum from Vanden Berk et al. (2001; smooth red curve) is over-plotted, shifted to the redshift of the quasar and normalised to the total flux density between 3900 Å and 9000 Å (observer frame). At the top of each panel, the SDSS name, the redshift z, and the parameter FFT = first_fr_type (0 – not detected by FIRST; 1 – core-dominated radio source) from the Shen catalogue are given. The dotted vertical lines indicate the usually strong emission lines.
Current usage metrics show cumulative count of Article Views (full-text article views including HTML views, PDF and ePub downloads, according to the available data) and Abstracts Views on Vision4Press platform.
Data correspond to usage on the plateform after 2015. The current usage metrics is available 48-96 hours after online publication and is updated daily on week days.
Initial download of the metrics may take a while.