Fig. 9
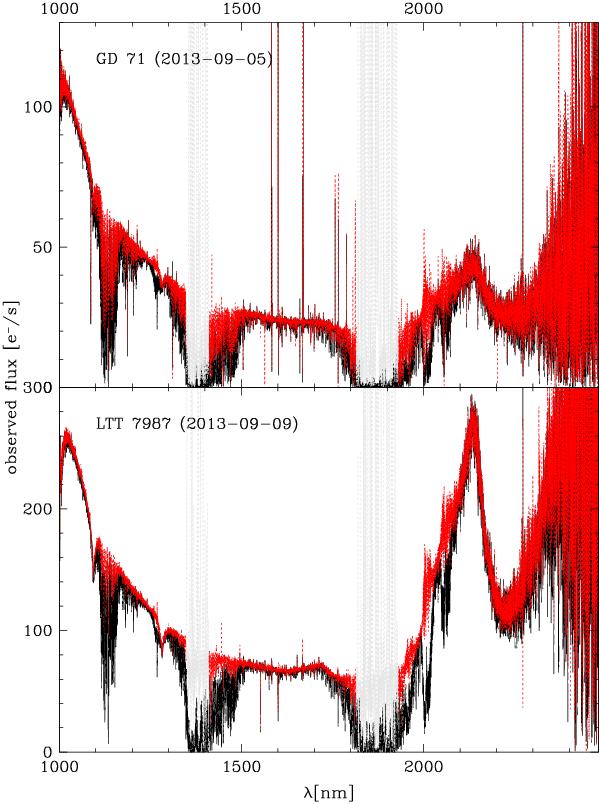
Results of the telluric correction (red) for a bad (top) and a good (bottom) case. The grey areas mark regions of extremely high telluric absorption and thus high noise in the corrected data. The lines at 1093.5 nm and 1281.4 nm are stellar lines and the variable peak at about 2100 nm is caused by variations in the flux level and spectral energy distribution of the NIR flat field lamp.
Current usage metrics show cumulative count of Article Views (full-text article views including HTML views, PDF and ePub downloads, according to the available data) and Abstracts Views on Vision4Press platform.
Data correspond to usage on the plateform after 2015. The current usage metrics is available 48-96 hours after online publication and is updated daily on week days.
Initial download of the metrics may take a while.