Fig. 7
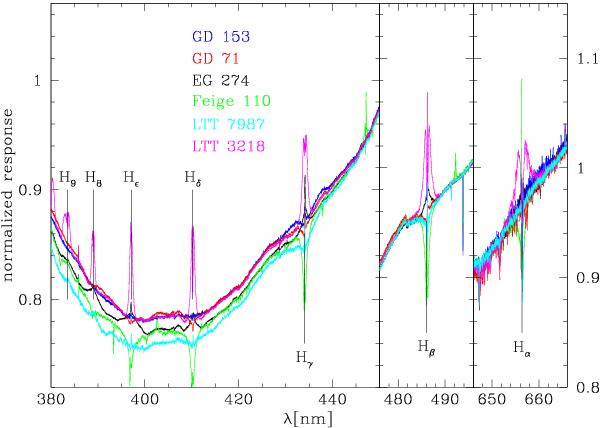
Average ratios of observed standard star spectrum (corrected for atmospheric extinction) and shifted reference spectrum for UVB and VIS data for the regions containing Balmer lines, using the bump-corrected model spectra. The curves have been normalized at the red end of the respective plot windows, which show the Balmer lines Hα (right), Hβ (middle), and Hγ to H9 (left). The two narrow windows on the right share the same range along the y-axis.
Current usage metrics show cumulative count of Article Views (full-text article views including HTML views, PDF and ePub downloads, according to the available data) and Abstracts Views on Vision4Press platform.
Data correspond to usage on the plateform after 2015. The current usage metrics is available 48-96 hours after online publication and is updated daily on week days.
Initial download of the metrics may take a while.