Fig. 4
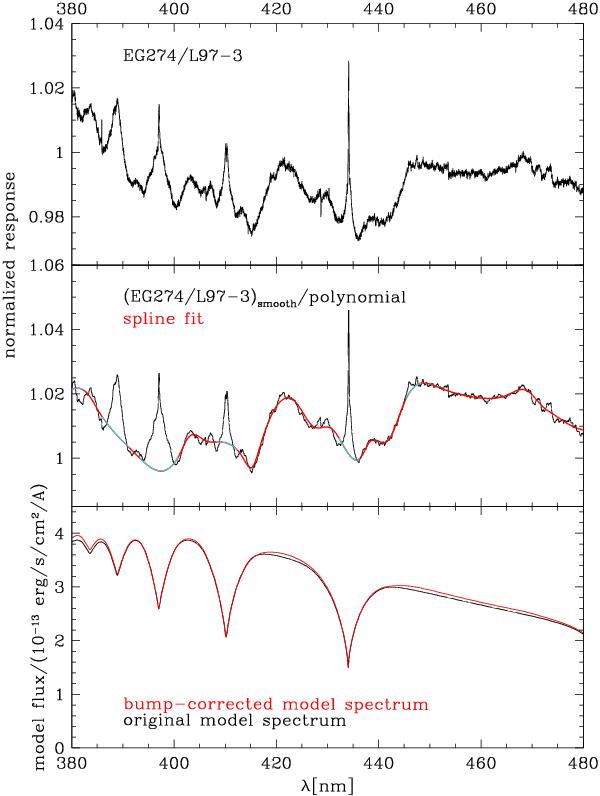
Top: average raw response (extinction-corrected observation)/(radial-velocity shifted model), divided by the smoothed response for L97-3, for EG 274. The narrow spikes are due to mismatches in the line cores, while the broad bumps at 405 nm and 420 nm are due to imperfect line broadening, which underestimates the flux between the lines in the model spectra. Middle: raw response from the top plot, with large scale variations removed by a low-order polynomial fit and smoothed (black). The black curve was fit with a spline (red) after masking the regions of the line cores (masked regions in cyan). Bottom: model spectrum before correction (black) and corrected with the fit (red).
Current usage metrics show cumulative count of Article Views (full-text article views including HTML views, PDF and ePub downloads, according to the available data) and Abstracts Views on Vision4Press platform.
Data correspond to usage on the plateform after 2015. The current usage metrics is available 48-96 hours after online publication and is updated daily on week days.
Initial download of the metrics may take a while.