Free Access
Fig. 2
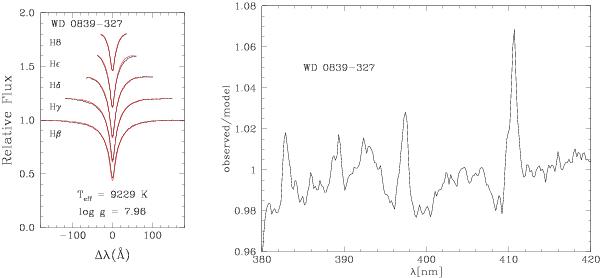
Model fit for LTT 3218 (individual lines only) from Giammichele et al. (2012, and the ratio between their observation and model spectrum (right). The ratio plot on the right clearly shows residuals in the line cores and also some bumps between the lines.
Current usage metrics show cumulative count of Article Views (full-text article views including HTML views, PDF and ePub downloads, according to the available data) and Abstracts Views on Vision4Press platform.
Data correspond to usage on the plateform after 2015. The current usage metrics is available 48-96 hours after online publication and is updated daily on week days.
Initial download of the metrics may take a while.