Free Access
Fig. 11
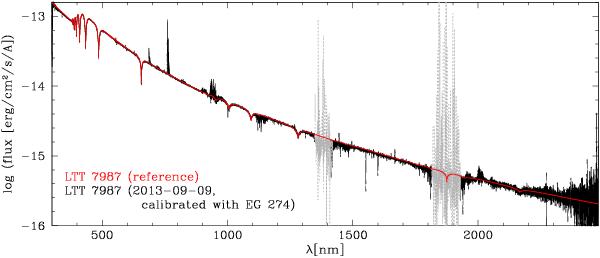
Spectrum of LTT 7987, corrected for telluric absorption and flux-calibrated with a response curve derived from observations of EG 274. The red curve is the reference spectrum for LTT 7987. Regions of very high telluric absorption are marked in grey.
Current usage metrics show cumulative count of Article Views (full-text article views including HTML views, PDF and ePub downloads, according to the available data) and Abstracts Views on Vision4Press platform.
Data correspond to usage on the plateform after 2015. The current usage metrics is available 48-96 hours after online publication and is updated daily on week days.
Initial download of the metrics may take a while.