Fig. 5
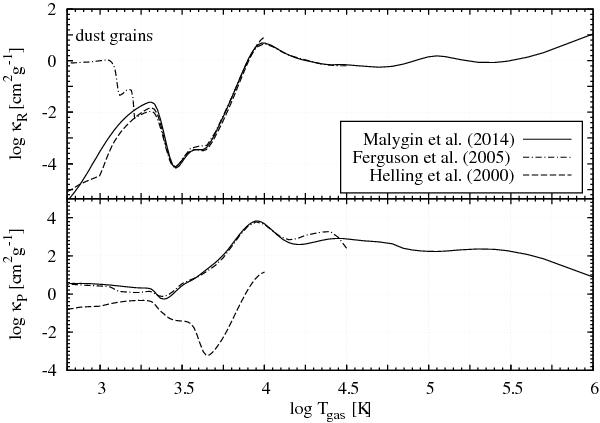
Mean opacity: comparison to other studies. The Rosseland (top panel) and the Planck (bottom panel) means at a constant gas density of 10-10g cm-3. This work – solid line, Helling et al. (2000) – dashed, and Ferguson et al. (2005) – dot-dashed. Data from Ferguson et al. (2005) contain opacity from dust grains. At lower temperatures the Rosseland average from the dust opacity dominates the Rosseland average from the gas opacity, but the Planck mean of the dust is comparable to the Planck mean of the gas.
Current usage metrics show cumulative count of Article Views (full-text article views including HTML views, PDF and ePub downloads, according to the available data) and Abstracts Views on Vision4Press platform.
Data correspond to usage on the plateform after 2015. The current usage metrics is available 48-96 hours after online publication and is updated daily on week days.
Initial download of the metrics may take a while.