Fig. 1
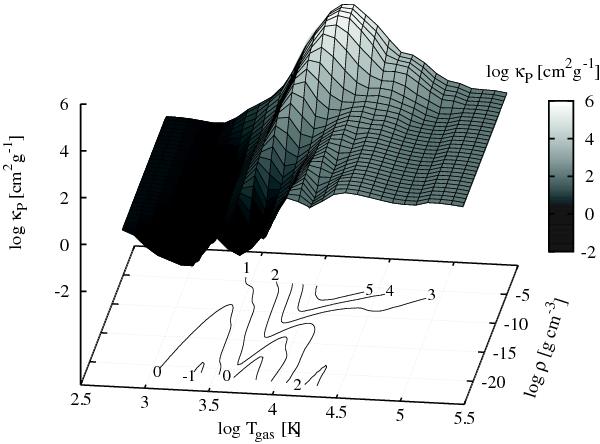
Surface of the Planck mean gas opacity in logarithmic parameter space. The contours on the xy-plane are iso-contours log κP = const., the labels giving the values. The colour scale is the same as the height-scale. The grid is superimposed only for better rendering and does not reproduce the actual computational grid, which is irregular. See text for more details.
Current usage metrics show cumulative count of Article Views (full-text article views including HTML views, PDF and ePub downloads, according to the available data) and Abstracts Views on Vision4Press platform.
Data correspond to usage on the plateform after 2015. The current usage metrics is available 48-96 hours after online publication and is updated daily on week days.
Initial download of the metrics may take a while.