Fig. 5
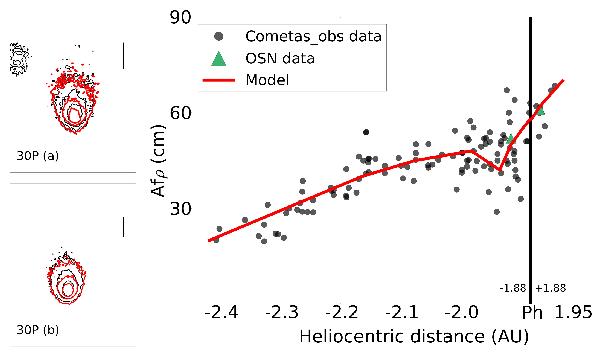
Representative figure of the comparison between observations and model of comet 30P/Reinmuth 1. Left panels: isophote fields a) March 10, 2010; and b) May 15, 2010. In both cases, isophote levels are 2.00 × 10⁻¹³, 0.75 × 10⁻¹³, and 0.25 × 10⁻¹³ SDU. The black contours correspond to the OSN observations and the red contours to the model. Vertical bars correspond to 104 km on the sky. Right panel: parameter Afρ versus heliocentric distance. The black dots correspond to Cometas-Obs data, and the green triangles are the OSN data, which correspond to March 10 and May 15, 2010. The red line is the model. The observations and the model refer to ρ = 104 km. In Appendix C, the comparison between observations and models for each comet individually are displayed (see Figs. C.1 to C.7).
Current usage metrics show cumulative count of Article Views (full-text article views including HTML views, PDF and ePub downloads, according to the available data) and Abstracts Views on Vision4Press platform.
Data correspond to usage on the plateform after 2015. The current usage metrics is available 48-96 hours after online publication and is updated daily on week days.
Initial download of the metrics may take a while.