Fig. 4
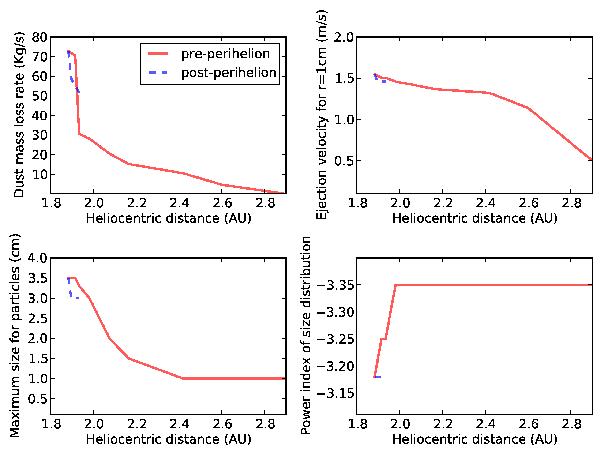
Representative figure of the evolution of the dust parameter evolution obtained in the model versus the heliocentric distance for comet 30P/Reinmuth 1. The panels are as follows: a) dust mass-loss rate [kg/s]; b) ejection velocities for particles of r = 1 cm glassy carbon spheres [m/s]; c) maximum size of the particles [cm]; and d) power index of the size distribution. In all cases, the solid red lines correspond to pre-perihelion and the dashed blue lines to post-perihelion. In Appendix B, the results for each comet individually are displayed (see Figs. B.1 to B.7).
Current usage metrics show cumulative count of Article Views (full-text article views including HTML views, PDF and ePub downloads, according to the available data) and Abstracts Views on Vision4Press platform.
Data correspond to usage on the plateform after 2015. The current usage metrics is available 48-96 hours after online publication and is updated daily on week days.
Initial download of the metrics may take a while.