Free Access
Fig. 11
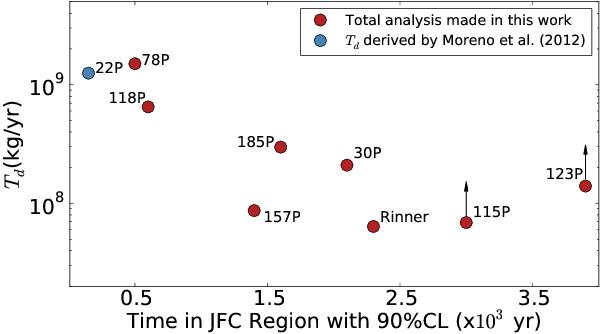
Annual dust production rate of our targets obtained in the dust analysis (see Sect. 4) versus the time in the JFCs region with a 90% confidence level derived in dynamical studies (see Sect. 5). The comets with arrows mean the Td given for them are lower limits.
Current usage metrics show cumulative count of Article Views (full-text article views including HTML views, PDF and ePub downloads, according to the available data) and Abstracts Views on Vision4Press platform.
Data correspond to usage on the plateform after 2015. The current usage metrics is available 48-96 hours after online publication and is updated daily on week days.
Initial download of the metrics may take a while.