Free Access
Fig. 6
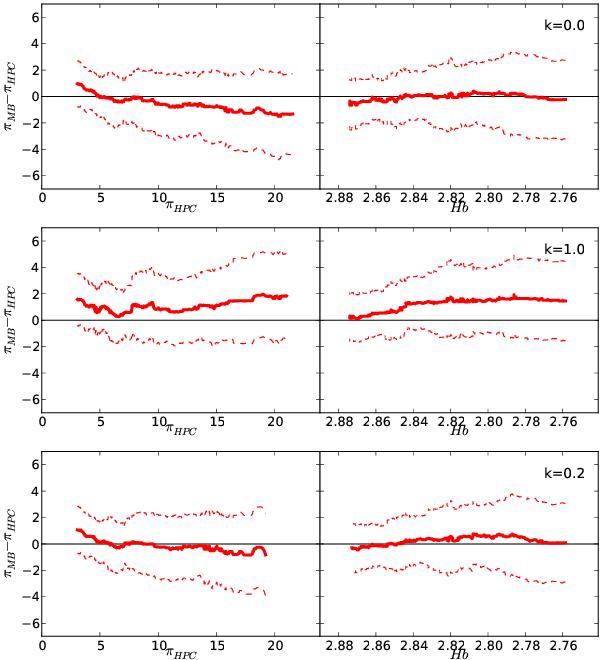
Running median for the difference between MB and Hipparcos parallaxes vs. Hipparcos parallax (left) and vs. Teff indicator for the late region (A3-A9; right). Top: k = 0. Center: k = 1. Bottom: k = 0.2. The solid line shows the moving median and the dashed line is one standard deviation. Parallaxes are given in mas.
Current usage metrics show cumulative count of Article Views (full-text article views including HTML views, PDF and ePub downloads, according to the available data) and Abstracts Views on Vision4Press platform.
Data correspond to usage on the plateform after 2015. The current usage metrics is available 48-96 hours after online publication and is updated daily on week days.
Initial download of the metrics may take a while.