Fig. 8
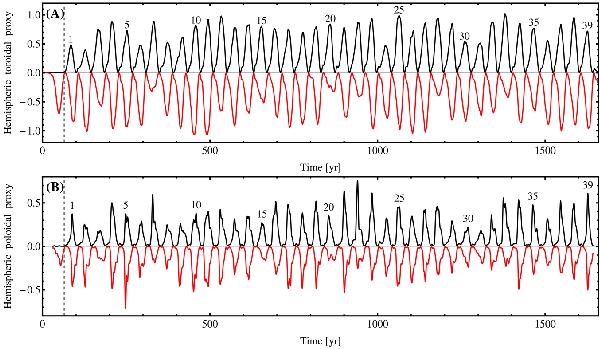
Solar cycle proxies built from the millennium simulation. Black and red lines represent magnetic activity on the northern and southern hemispheres correspondingly. Panel A) shows the toroidal proxies, BN and −BS. In panel B) we present the poloidal (dipolar) proxies, AN and −AS. The southern proxies are plotted with a negative sign to better illustrate the coupling differences between both hemispheres.
Current usage metrics show cumulative count of Article Views (full-text article views including HTML views, PDF and ePub downloads, according to the available data) and Abstracts Views on Vision4Press platform.
Data correspond to usage on the plateform after 2015. The current usage metrics is available 48-96 hours after online publication and is updated daily on week days.
Initial download of the metrics may take a while.