Fig. 7
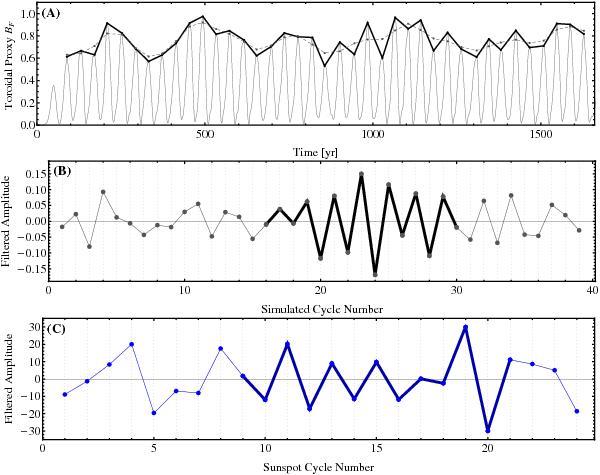
The Gnevyshev-Ohl pattern in our full-disk toroidal proxy. Panel A) shows the sequence of cycle maxima (black), and the corresponding 1-2-1 running mean thereof (dashed); subtracting the latter yields the detrended sequence plotted in panel B). The G-O pattern shows up here as a sustained regular alternance between positive and negative detrended values, e.g. between simulated cycles 16 and 30 (thick segments). Panel C) shows a similarly detrended cycle amplitude sequence for the monthly smoothed SSN; here the G-O pattern holds uninterrupted from sunspot cycle 9 to 21 (thick segments).
Current usage metrics show cumulative count of Article Views (full-text article views including HTML views, PDF and ePub downloads, according to the available data) and Abstracts Views on Vision4Press platform.
Data correspond to usage on the plateform after 2015. The current usage metrics is available 48-96 hours after online publication and is updated daily on week days.
Initial download of the metrics may take a while.