Fig. 4
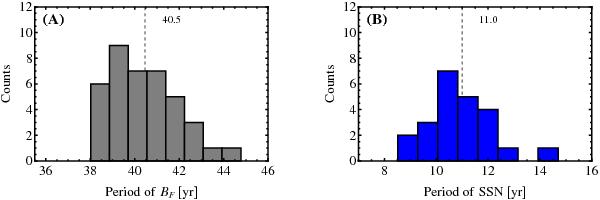
Histograms of frequency counts for the cycle periods for our full-disk toroidal proxy BF (panel A)) and the smoothed monthly SSN (panel B)). The vertical dashed lines represent the distributions means at 40.5 and 11 years correspondingly. Although the means differ by a factor of almost four, the two distributions show similar standard deviations and skewness (see text).
Current usage metrics show cumulative count of Article Views (full-text article views including HTML views, PDF and ePub downloads, according to the available data) and Abstracts Views on Vision4Press platform.
Data correspond to usage on the plateform after 2015. The current usage metrics is available 48-96 hours after online publication and is updated daily on week days.
Initial download of the metrics may take a while.