Fig. 2
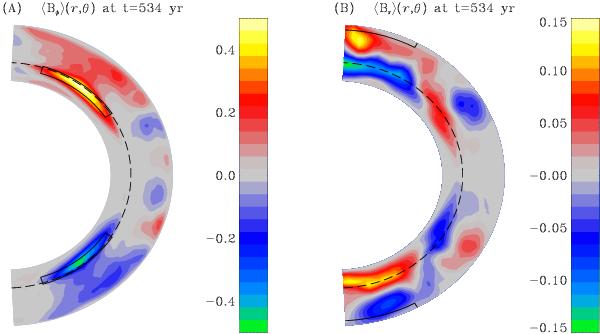
Meridional plot of the large scale, zonally-averaged toroidal field (panel A)) and zonally-averaged radial field (panel B)), extracted at t = 534 yr, a cycle maximum indicated by the vertical dotted black line in Fig. 1. The color scale on the right is in Tesla. The bounding boxes represent the integration regions for the proxies computation, individually for the northern and southern hemispheres. The dashed circular arc corresponds to r/R⊙ = 0.718, the interface between the convecting layers and underlying convectively stable fluid.
Current usage metrics show cumulative count of Article Views (full-text article views including HTML views, PDF and ePub downloads, according to the available data) and Abstracts Views on Vision4Press platform.
Data correspond to usage on the plateform after 2015. The current usage metrics is available 48-96 hours after online publication and is updated daily on week days.
Initial download of the metrics may take a while.