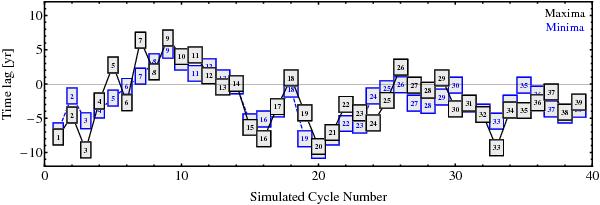
Fig. 14

Time lag measured between the two hemispheres for minima (blue, dashed line) and maxima (black, thick line). Negative values indicate that the northern hemisphere cycle leads its southern counterpart. The numbers inside the squares represent the simulated cycle number. The mean lag values are −2.6 yr for minima and −2.3 yr for maxima, amounting to about 6% of the mean cycle duration. The largest individual lag values approach 10 years for cycles 3, 20 and 33, i.e. 25% of the mean cycle duration.
Current usage metrics show cumulative count of Article Views (full-text article views including HTML views, PDF and ePub downloads, according to the available data) and Abstracts Views on Vision4Press platform.
Data correspond to usage on the plateform after 2015. The current usage metrics is available 48-96 hours after online publication and is updated daily on week days.
Initial download of the metrics may take a while.


