Fig. 11
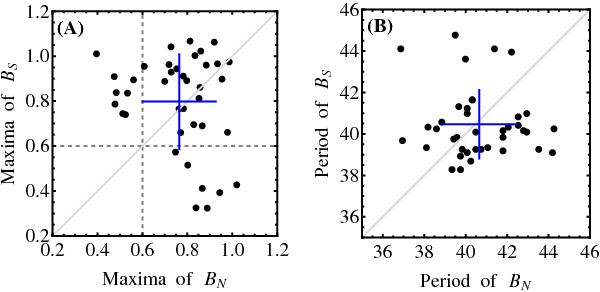
Correlation between northern and southern maxima A) and period B) in the time series of toroidal proxies BN and BS. In the two panels the thick blue cross indicates the mean values ±one standard deviation. In A) the horizontal and vertical dashed lines, drawn at BN = 0.6 and BS = 0.6, delineate the cycles belonging to the two modes of the distributions in Fig. 10. The diagonal light gray line indicates a perfect correlation (BN = BS).
Current usage metrics show cumulative count of Article Views (full-text article views including HTML views, PDF and ePub downloads, according to the available data) and Abstracts Views on Vision4Press platform.
Data correspond to usage on the plateform after 2015. The current usage metrics is available 48-96 hours after online publication and is updated daily on week days.
Initial download of the metrics may take a while.