Fig. 10
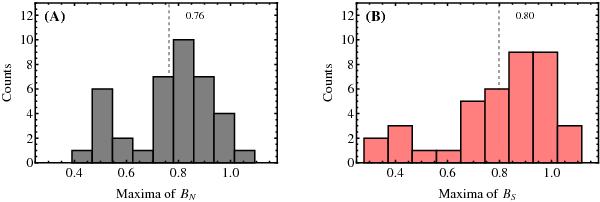
Histograms of the cycle peak amplitudes, based on the toroidal proxies, measured in the A) north and B) south hemispheres. Although the distributions are built from a relatively small sample of cycle maxima, both hemispheres show a clear hint of bimodality, in the form of a subgroup of low-amplitude cycles. Vertical dashed lines indicate mean values
Current usage metrics show cumulative count of Article Views (full-text article views including HTML views, PDF and ePub downloads, according to the available data) and Abstracts Views on Vision4Press platform.
Data correspond to usage on the plateform after 2015. The current usage metrics is available 48-96 hours after online publication and is updated daily on week days.
Initial download of the metrics may take a while.