Fig. 1
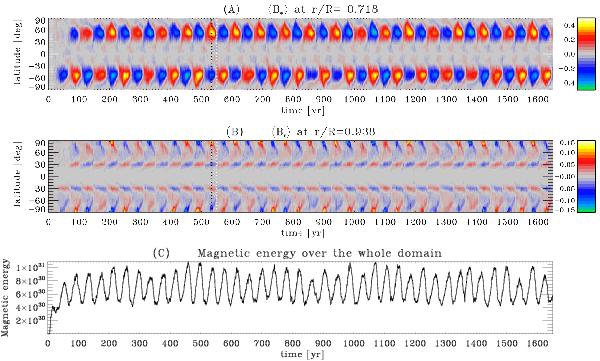
Panel A) Time latitude diagram of the zonally-averaged toroidal field taken at r/R⊙ = 0.718, which marks the interface between the convecting layers and underlying stably stratified region. Panel B) Zonally-averaged radial field extracted from the simulation’s subsurface layer, at r/R⊙ = 0.938. The color scale encodes the magnetic field strength, values in Tesla. Panel C) Evolution of the total magnetic energy integrated over the whole computational domain. The simulation uses a hydrostatic initial state, subjected to small perturbations in fluid velocity and magnetic field. Convection reaches a statistically stationary state after about a year, but the buildup of a stable, cyclic large-scale axisymmetric magnetic component sets in after about fifty years, here first in the southern hemisphere. Dipolar parity is maintained here through 20 full magnetic cycles.


Current usage metrics show cumulative count of Article Views (full-text article views including HTML views, PDF and ePub downloads, according to the available data) and Abstracts Views on Vision4Press platform.
Data correspond to usage on the plateform after 2015. The current usage metrics is available 48-96 hours after online publication and is updated daily on week days.
Initial download of the metrics may take a while.