Fig. 2
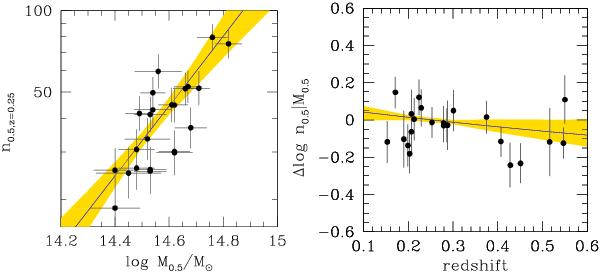
Mass-richness scaling (left-hand panel) and residuals (observed minus expected) as a function of redshift (right-hand panel) accounting for the mass and selection functions. The solid line marks the mean fitted regression line. The shaded region marks the 68% uncertainty (highest posterior density interval) for the regression. In the left panel, measurements are corrected for evolution.
Current usage metrics show cumulative count of Article Views (full-text article views including HTML views, PDF and ePub downloads, according to the available data) and Abstracts Views on Vision4Press platform.
Data correspond to usage on the plateform after 2015. The current usage metrics is available 48-96 hours after online publication and is updated daily on week days.
Initial download of the metrics may take a while.