Fig. 3
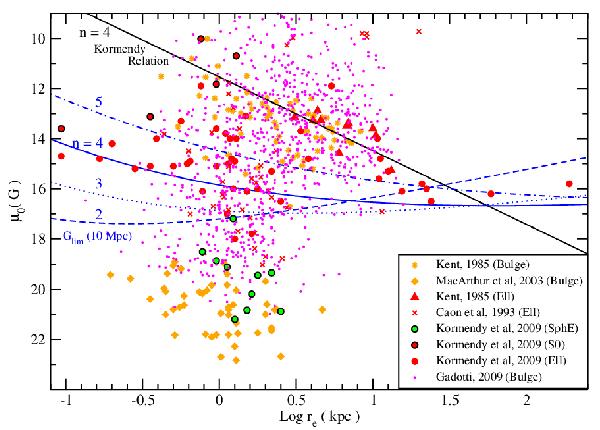
Central brightness distribution versus effective radius of spheroids of the same data sources used in Fig. 2. The black line indicates the predicted position of brightness profiles obeying the Kormendy relation for an index n = 4 of the Sérsic profile. The vertical spread of the data is due to variations in the index n observed in the observed profiles. Objects with steeper profiles (n> 4) are located above that line, while objects with softer profiles (n< 4) populate the lower region. The blue lines correspond to the limiting surface brightness of Sérsic spheroids at a fiducial distance equal to 10 Mpc having G = 20 mag in the Gaia SM section. Objects located above the limiting line are able to be detected, and depending on the Sérsic index (n), the location of the limit of detection will be different. For n> 4 the predicted location of most objects, according to the Kormendy relation, is situated above the limiting curve and therefore they should be detected by Gaia. In contrast, spheroids having softer profiles, as shown in the sample of the MacArthur et al. (2003) bulges tend to be located below the Gaia detection limit and should not be detected.
Current usage metrics show cumulative count of Article Views (full-text article views including HTML views, PDF and ePub downloads, according to the available data) and Abstracts Views on Vision4Press platform.
Data correspond to usage on the plateform after 2015. The current usage metrics is available 48-96 hours after online publication and is updated daily on week days.
Initial download of the metrics may take a while.