Fig. 2
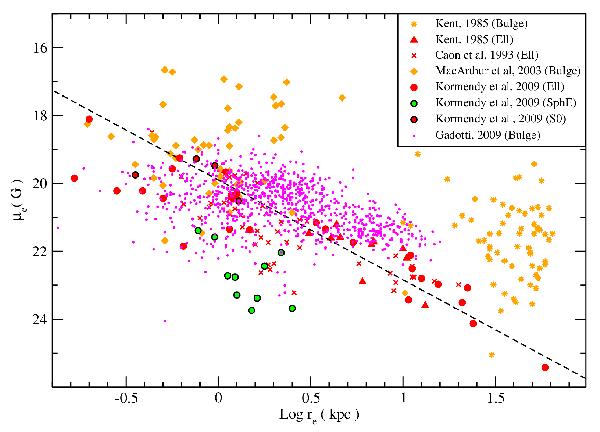
Correlation between the effective brightness and effective radius observed in nearby spheroids. The orange circles and red triangles respectively represent the bulges and ellipticals from Kent (1985a). The red crosses are the Virgo cluster ellipticals from Caon et al. (1993). The orange diamonds are the bulge data from MacArthur et al. (2003). The red circles are the ellipticals from Kormendy et al. (2009). The small pink circles represent the sample of bulges studied by Gadotti (2009). The dashed line represents the Hamabe & Kormendy (1987) empirical relation.
Current usage metrics show cumulative count of Article Views (full-text article views including HTML views, PDF and ePub downloads, according to the available data) and Abstracts Views on Vision4Press platform.
Data correspond to usage on the plateform after 2015. The current usage metrics is available 48-96 hours after online publication and is updated daily on week days.
Initial download of the metrics may take a while.