Open Access
Fig. 6
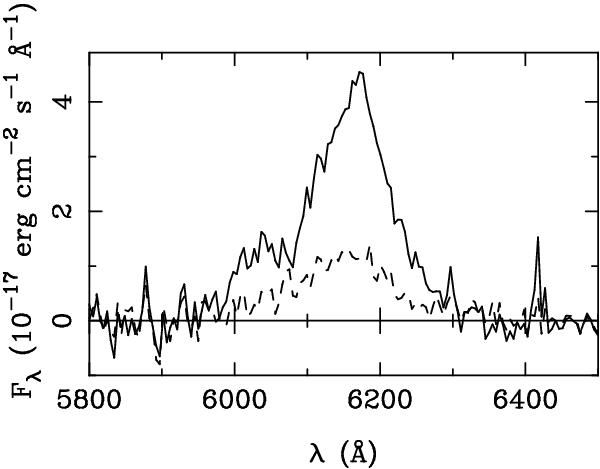
C iii] emission line profiles. For each quasar image, we take the continuum in the intervals 5800−5950 and 6350−6500 Å, fit it to a quadratic law, and then remove the fitted quadratic trend. The solid line traces the line profile for the image A. The dashed line describes the line profile for image B.
Current usage metrics show cumulative count of Article Views (full-text article views including HTML views, PDF and ePub downloads, according to the available data) and Abstracts Views on Vision4Press platform.
Data correspond to usage on the plateform after 2015. The current usage metrics is available 48-96 hours after online publication and is updated daily on week days.
Initial download of the metrics may take a while.