Open Access
Fig. 10
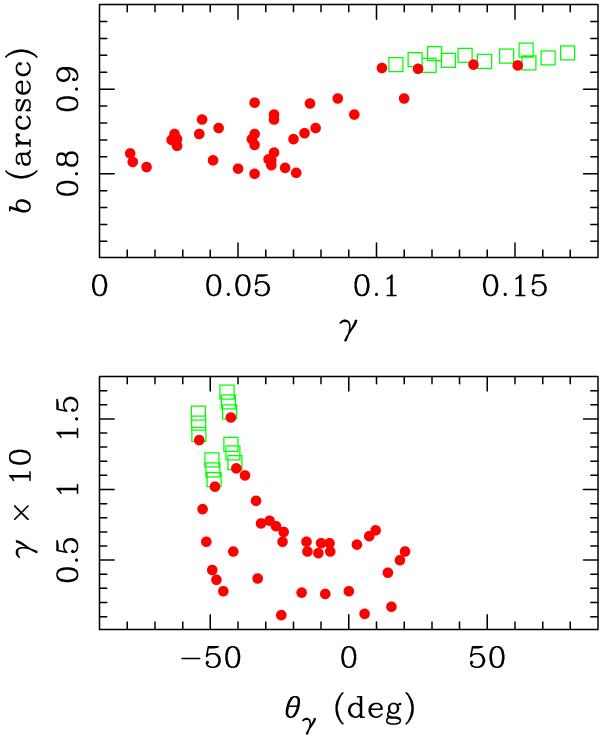
SIE + γ mass model of SDSS J1339+1310. The green squares and red circles have the same meaning as those in Fig. 9. Top panel: mass scale vs. shear strength. Bottom panel: shear strength vs. shear direction.
Current usage metrics show cumulative count of Article Views (full-text article views including HTML views, PDF and ePub downloads, according to the available data) and Abstracts Views on Vision4Press platform.
Data correspond to usage on the plateform after 2015. The current usage metrics is available 48-96 hours after online publication and is updated daily on week days.
Initial download of the metrics may take a while.