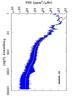
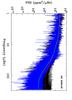
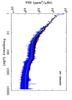
Fig. 8
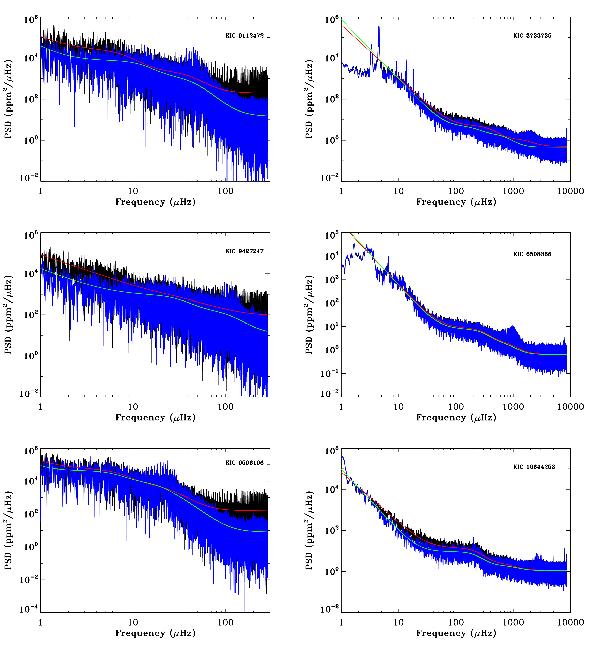
Results of the background fits as describe in the text for three red giants (left panels) and three solar-like stars smoothed over 10 bins (right panels). Spectra obtained from gapped data are shown in black, while spectra after inpainting the light curves are in blue. The background fits are represented in red (resp. green) for the data with gaps (resp. inpainted data).
Current usage metrics show cumulative count of Article Views (full-text article views including HTML views, PDF and ePub downloads, according to the available data) and Abstracts Views on Vision4Press platform.
Data correspond to usage on the plateform after 2015. The current usage metrics is available 48-96 hours after online publication and is updated daily on week days.
Initial download of the metrics may take a while.