Fig. 4
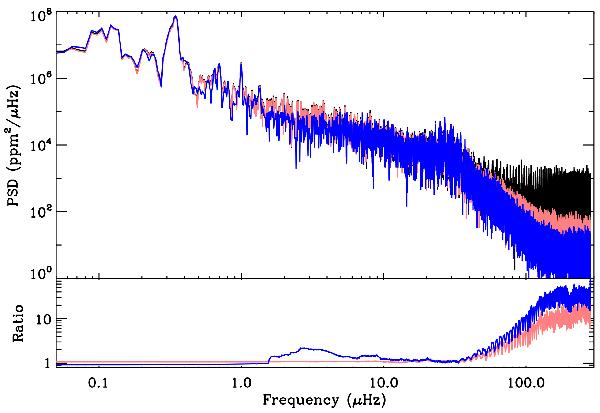
Top: PSD on logarithmic scale of KIC 2305930 smoothed using a 3-point boxcar function. The black curve corresponds to the original light curve. The pink curve is the PSD after correcting all the gaps with sizes less than 1 h (two long-cadence points), while the blue curve is the PSD after inpainting all the gaps less than 20 days. Bottom: ratio between the interpolated PSDs and the one with all the gaps. Both curves have been smoothed using a 300 point boxcar function.
Current usage metrics show cumulative count of Article Views (full-text article views including HTML views, PDF and ePub downloads, according to the available data) and Abstracts Views on Vision4Press platform.
Data correspond to usage on the plateform after 2015. The current usage metrics is available 48-96 hours after online publication and is updated daily on week days.
Initial download of the metrics may take a while.