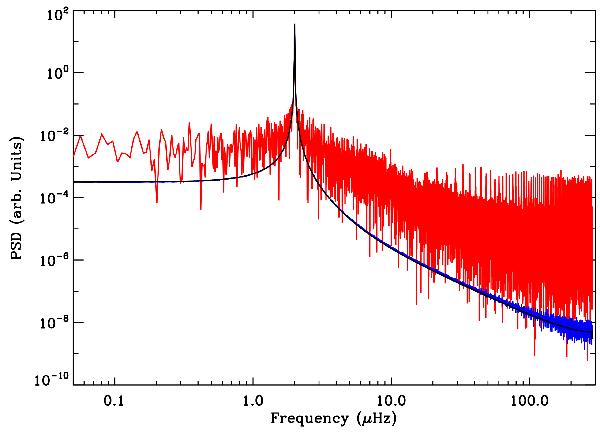
Fig. 3

Power spectral density (PSD) on logarithmic scale of a 2 μHz ideal sine wave (black) following the Barycentric Kepler Julian Date (BKJD, see Appendix A for further details). The red curve corresponds to the PSD of the same sine wave multiplied by the Kepler window function. Both PSDs were computed using a Lomb-Scargle algorithm. The blue line is the PSD resulting from converting the timing BKJD of the ideal sine wave (without gaps) into a regular grid and computed using a FFT.
Current usage metrics show cumulative count of Article Views (full-text article views including HTML views, PDF and ePub downloads, according to the available data) and Abstracts Views on Vision4Press platform.
Data correspond to usage on the plateform after 2015. The current usage metrics is available 48-96 hours after online publication and is updated daily on week days.
Initial download of the metrics may take a while.


