Free Access
Fig. B.2
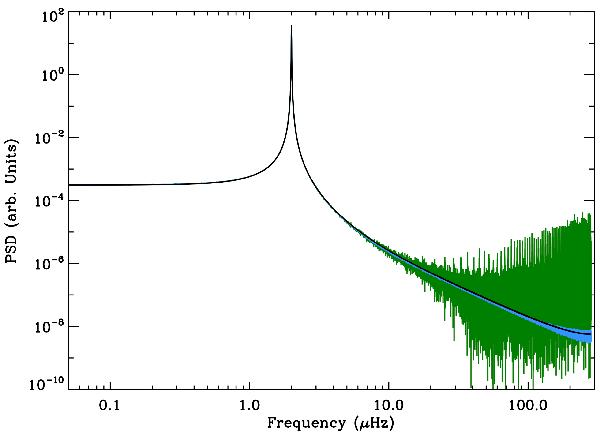
PSD of the same simulation as in Fig. 2 (black curve). The green curve is computed using an absolute regular grid of points in all the gaps. The light blue curve corresponds to the PSD calculated using a regular grid of points in the gaps in which the reference time for each gap is the last correct point.
Current usage metrics show cumulative count of Article Views (full-text article views including HTML views, PDF and ePub downloads, according to the available data) and Abstracts Views on Vision4Press platform.
Data correspond to usage on the plateform after 2015. The current usage metrics is available 48-96 hours after online publication and is updated daily on week days.
Initial download of the metrics may take a while.