Free Access
Fig. 10
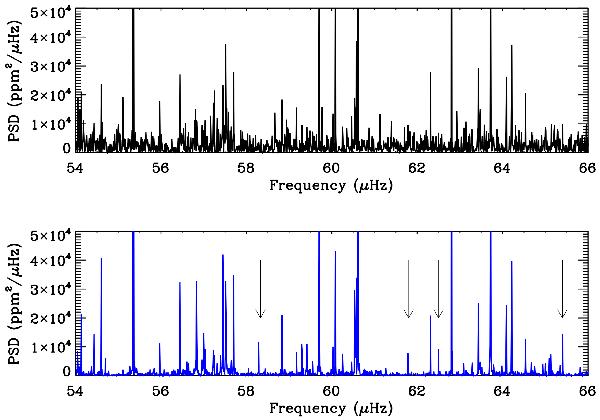
Zoom of the PSD shown in Fig.9 for a region of the PSD between 54 and 66 μHz. The top panel corresponds to the original PSD, and the bottom panel is the PSD obtained from the inpainted light curve (in blue). Vertical arrows mark new peaks found with this analysis.
Current usage metrics show cumulative count of Article Views (full-text article views including HTML views, PDF and ePub downloads, according to the available data) and Abstracts Views on Vision4Press platform.
Data correspond to usage on the plateform after 2015. The current usage metrics is available 48-96 hours after online publication and is updated daily on week days.
Initial download of the metrics may take a while.