Free Access
Fig. 1
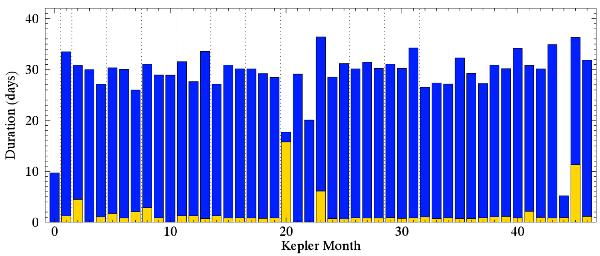
Duration of observations (blue bars) and data gaps (yellow bars) during the 47 “Kepler months”, from Q0 to Q16. The Kepler scientific observations started on May 2, 2009 at 00:55 UT time.
Current usage metrics show cumulative count of Article Views (full-text article views including HTML views, PDF and ePub downloads, according to the available data) and Abstracts Views on Vision4Press platform.
Data correspond to usage on the plateform after 2015. The current usage metrics is available 48-96 hours after online publication and is updated daily on week days.
Initial download of the metrics may take a while.