Fig. 7
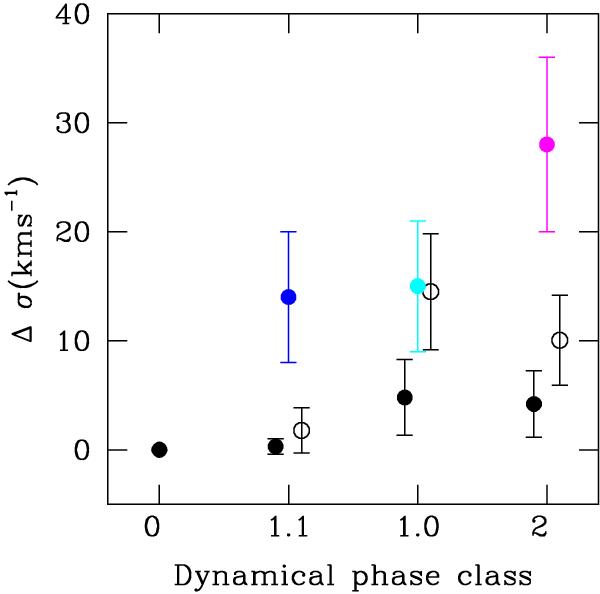
Mean change of the velocity dispersion of the ionized gas (i.e. narrow component) as a function of the dynamical phase for non-AGN U/LIRGs, using the isolated discs (i.e., class 0) as reference. Coloured dots correspond to the observed mean values for individual galaxies in interacting systems (1.1, blue), global interacting systems (1.0, cyan), and mergers (2, magenta). Black dots correspond to the predicted change due to the mean SFR derived from the infrared luminosity (open dots) and Hα (solid dots) for the different classes, according to the relations found in 4.1.2. The plot shows that only SFR cannot explain in general the observed change in velocity dispersion among the different classes. The points have been slightly shifted horizontally to avoid overlap.
Current usage metrics show cumulative count of Article Views (full-text article views including HTML views, PDF and ePub downloads, according to the available data) and Abstracts Views on Vision4Press platform.
Data correspond to usage on the plateform after 2015. The current usage metrics is available 48-96 hours after online publication and is updated daily on week days.
Initial download of the metrics may take a while.