Fig. 6
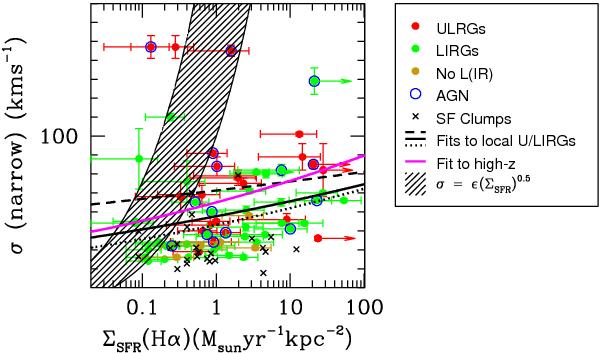
Velocity dispersion of the ISM (narrow component) as a function of the star
formation density, ΣSFR, derived considering the extinction corrected
Hα
fluxes (see text), and Hα half-light radii (Arribas et al. 2012). The symbol and line codes are indicated
in the right panel. The black continuous line corresponds to an
unweighted regression to all the U/LIRGs (σ , n = 0.06 ± 0.03,
r =
0.3), while the dotted and dashed lines are for non-AGNs
(n =
0.06, r = 0.4) and AGNs (n = 0.03,
r =
0.1), respectively. The shaded region corresponds to a
behaviour of the type σ
(km s
, n = 0.06 ± 0.03,
r =
0.3), while the dotted and dashed lines are for non-AGNs
(n =
0.06, r = 0.4) and AGNs (n = 0.03,
r =
0.1), respectively. The shaded region corresponds to a
behaviour of the type σ
(km s for efficiencies (ϵ) between 100 and
240, which is expected for SF driven motions (Lehnert et al. 2009). The magenta line corresponds to the unweighted) fit,
found by Genzel et al. (2011), to a large
compilation of high-z galaxies and clumps (see text).
for efficiencies (ϵ) between 100 and
240, which is expected for SF driven motions (Lehnert et al. 2009). The magenta line corresponds to the unweighted) fit,
found by Genzel et al. (2011), to a large
compilation of high-z galaxies and clumps (see text).
Current usage metrics show cumulative count of Article Views (full-text article views including HTML views, PDF and ePub downloads, according to the available data) and Abstracts Views on Vision4Press platform.
Data correspond to usage on the plateform after 2015. The current usage metrics is available 48-96 hours after online publication and is updated daily on week days.
Initial download of the metrics may take a while.