Fig. 5
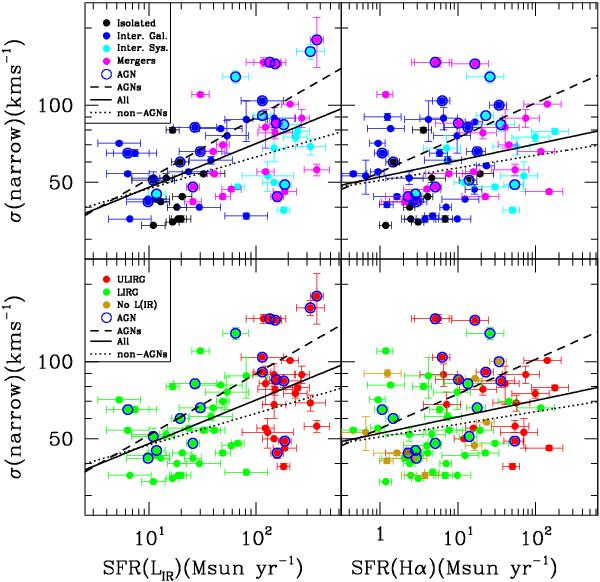
Velocity dispersion of the ISM (narrow component) as a function of the SFR as derived from the infrared (left panels) and the (reddening corrected) Hα (right panels) luminosities following Kennicutt (1998) with a Chabrier (2003) IMF (see text). Bottom panels: colours identify LIRGs (green), and ULIRGs (red). Objects without LIR data, are coded in orange. Upper panels: colours distinguish among the different dynamical classes according to the following code: black are isolated discs (class 0); blue full dots are individual objects in interacting systems (class 1.1); cyan: whole interacting systems (class 1.0); magenta: fully merged (class 2). Blue circles indicate objects with evidence of being affected by an AGN in the optical lines (see text). For the AGNs Mrk 231 and IRAS 13342+3932 (with highest σ values in the left panels) are not included in the right panels as they do not have reliable Hα absolute fluxes. Lines correspond to unweighted fits to all the data (continuous), only objects without AGN evidence (dotted), and only objects with AGN evidence (dashed). The error bars in the SFR(Hα) do not take into account the uncertainties associated with the reddening corrections.
Current usage metrics show cumulative count of Article Views (full-text article views including HTML views, PDF and ePub downloads, according to the available data) and Abstracts Views on Vision4Press platform.
Data correspond to usage on the plateform after 2015. The current usage metrics is available 48-96 hours after online publication and is updated daily on week days.
Initial download of the metrics may take a while.