Fig. 4
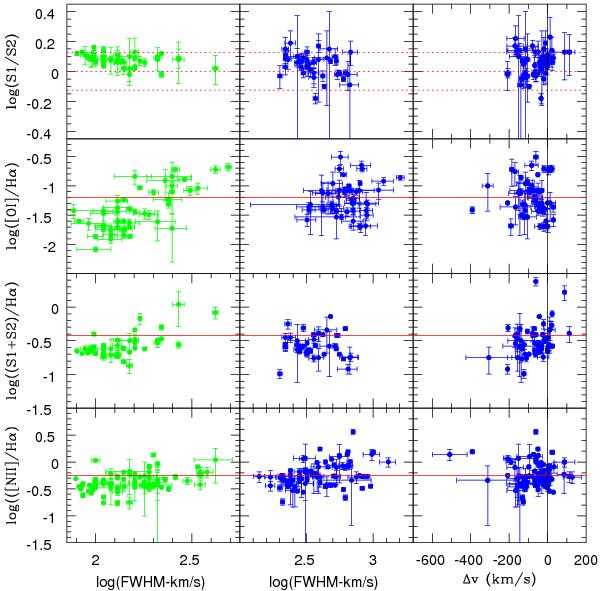
Line ratios as a function of the line width of the narrow and broad components (left and central panels, respectively), and their relative velocity shift (right panels). S1 = [SII] λ 6717 Å, and S2 = [SII] λ 6731 Å. Line widths are derived from the fits of the lines at the numerator. The solid horizontal red lines indicate the values for the border distinguishing between ionization by stars and other mechanisms (i.e., LINER, AGN) assuming a mean value of [OIII]/Hβ = − 0.2 (GM09a, Monreal-Ibero et al. 2010), according to Veilleux & Osterbrock (1987). The dotted red lines in the log(S1/S2) plots correspond to electron densities of 100 (top), 600 (middle), and 1000 (bottom) cm-3, assuming T = 104 K (Osterbrock 1989).
Current usage metrics show cumulative count of Article Views (full-text article views including HTML views, PDF and ePub downloads, according to the available data) and Abstracts Views on Vision4Press platform.
Data correspond to usage on the plateform after 2015. The current usage metrics is available 48-96 hours after online publication and is updated daily on week days.
Initial download of the metrics may take a while.