Fig. 3
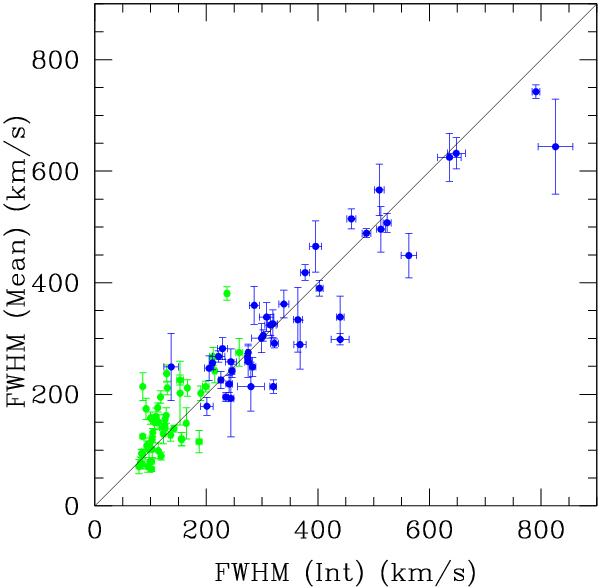
Line width from the integrated spectra versus the mean values obtained from the two-dimensional maps presented by Bellocchi et al. (2013) for the VIMOS sub-sample, for the narrow (green) and broad (blue) components. The line widths are represented in terms of FWHM for the narrow component also, which generally is expressed in σ units. The 1:1 line is shown as reference.
Current usage metrics show cumulative count of Article Views (full-text article views including HTML views, PDF and ePub downloads, according to the available data) and Abstracts Views on Vision4Press platform.
Data correspond to usage on the plateform after 2015. The current usage metrics is available 48-96 hours after online publication and is updated daily on week days.
Initial download of the metrics may take a while.