Fig. 2
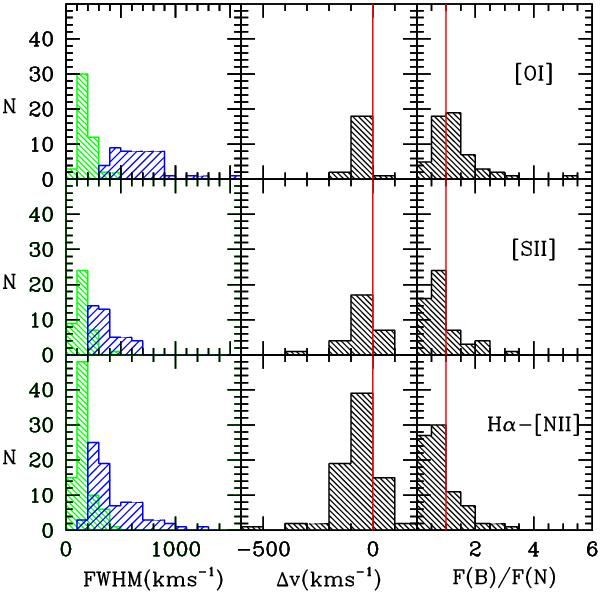
Line widths (FWHM), relative velocity shift (Δv), and relative line flux between the broad (blue) and narrow (green) components, as inferred from the Hα-[NII], [SII], and [OI] fits. Vertical red lines indicate the zero velocity shift, and the equal intensity level between the two components. The relative fewer values for [SII] and [OI] than for Hα-[NII] is because of the lower number of acceptable fits, and to the fact that in some cases the corresponding parameter was not independent (i.e., it was fixed according to the Hα-[NII] fit).
Current usage metrics show cumulative count of Article Views (full-text article views including HTML views, PDF and ePub downloads, according to the available data) and Abstracts Views on Vision4Press platform.
Data correspond to usage on the plateform after 2015. The current usage metrics is available 48-96 hours after online publication and is updated daily on week days.
Initial download of the metrics may take a while.