Fig. 15
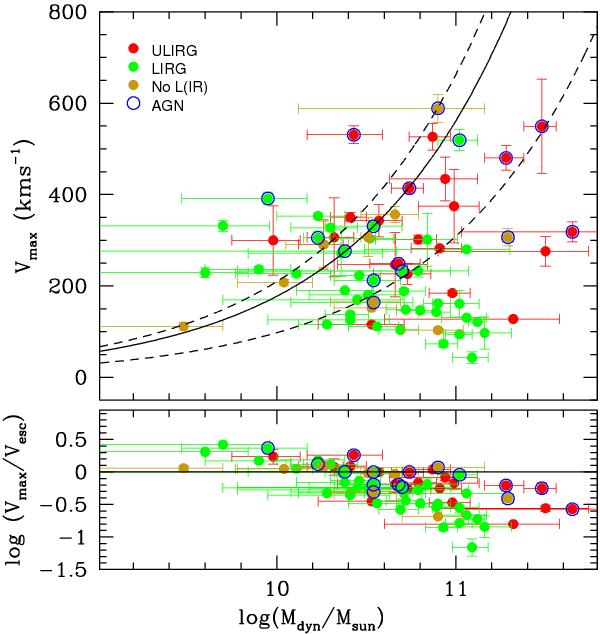
Top panel: maximum outflow velocity as a function of the dynamical mass. Red and green dots distinguish ULIRGs and LIRGs systems. Orange dots are objects without LIR determinations. Blue circles indicate objects with evidence of being affected by an AGN in the optical lines (see text). The solid line represents the mean escape velocity for r = 3 kpc, considering a simple model of a truncated isothermal sphere of rmax/r = 10. The dotted lines correspond to values for rmax/r = 1 and 100 (see text). Bottom panel: maximum outflow velocities represented in units of the escape velocity for the case rmax/r = 10.
Current usage metrics show cumulative count of Article Views (full-text article views including HTML views, PDF and ePub downloads, according to the available data) and Abstracts Views on Vision4Press platform.
Data correspond to usage on the plateform after 2015. The current usage metrics is available 48-96 hours after online publication and is updated daily on week days.
Initial download of the metrics may take a while.