Fig. 13
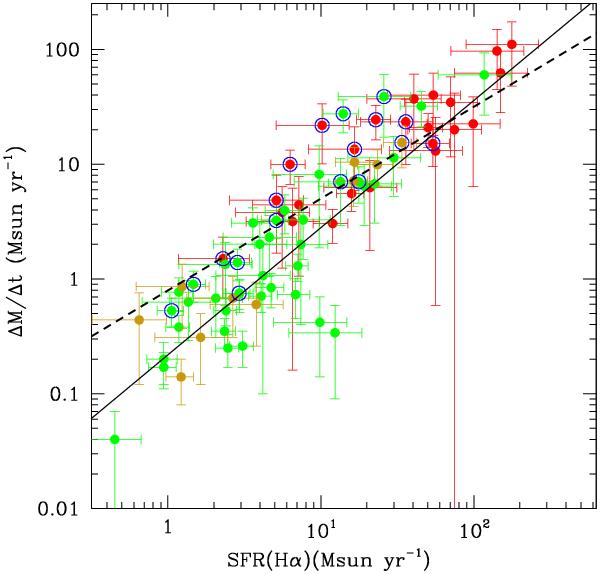
Mass outflow rate as a function of the SFR derived from the (reddening corrected)
Hα
luminosity. Symbols and colour code as in Fig. 12. The continuous line represents an unweighted linear fit (in log) to
the non-AGN LIRGs ( ). The discontinuous line is the
predicted behaviour according to the models by Hopkins et al. (2012) (
). The discontinuous line is the
predicted behaviour according to the models by Hopkins et al. (2012) ( ). See text.
Current usage metrics show cumulative count of Article Views (full-text article views including HTML views, PDF and ePub downloads, according to the available data) and Abstracts Views on Vision4Press platform.
Data correspond to usage on the plateform after 2015. The current usage metrics is available 48-96 hours after online publication and is updated daily on week days.
Initial download of the metrics may take a while.