Fig. 1
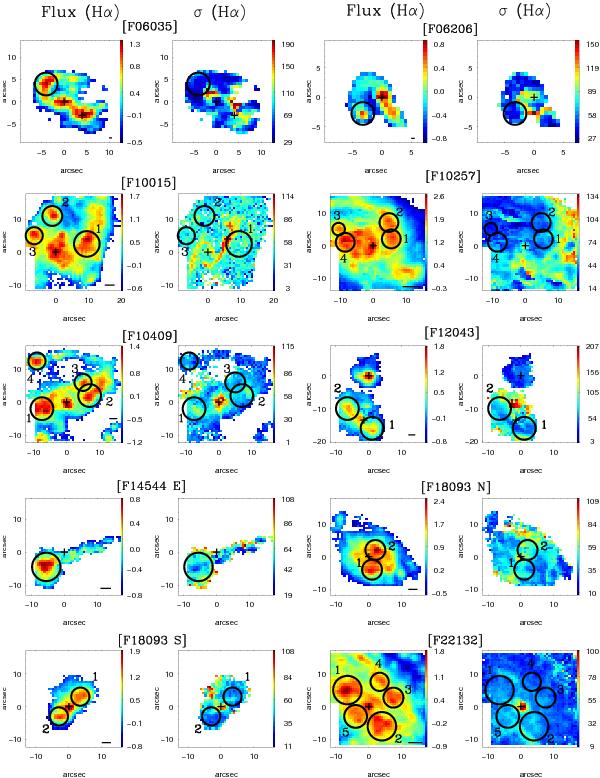
Hα emission and velocity dispersion maps of the narrow component for the sub-sample of galaxies for which extranuclear clumps of star formation are selected (see Bellocchi et al. 2013). The circles identify the SF clumps in the Hα flux and σ maps. The cross indicates the position of the optical nucleus. In the case of multiple galaxy systems the secondary nucleus is also indicated. The Hα flux emission per spaxel is such that F(erg s-1 cm-2) = 10−16+c, where c is indicated in the coloured bar. The units for the velocity dispersions are km s-1. North is at the top, and east at the left. The horizontal black bar indicates 1 kpc.
Current usage metrics show cumulative count of Article Views (full-text article views including HTML views, PDF and ePub downloads, according to the available data) and Abstracts Views on Vision4Press platform.
Data correspond to usage on the plateform after 2015. The current usage metrics is available 48-96 hours after online publication and is updated daily on week days.
Initial download of the metrics may take a while.